Event Description:
If you’ve tried using Power BI for financial analysis or reporting, you’ve likely found that simple things like subtotals, sorting and mixed formats (e.g. currency and percentages) for financial statements appear to be much harder than they should be!
But the data model that sits behind a Power BI report can support all of these things out of the box and brings many additional benefits compared to an excel based report such as rich visualisations for storytelling, built in time intelligence logic, cross filtering and the ability to drill through (e.g. from an Income statement line to the underlying journals/transactions behind it).
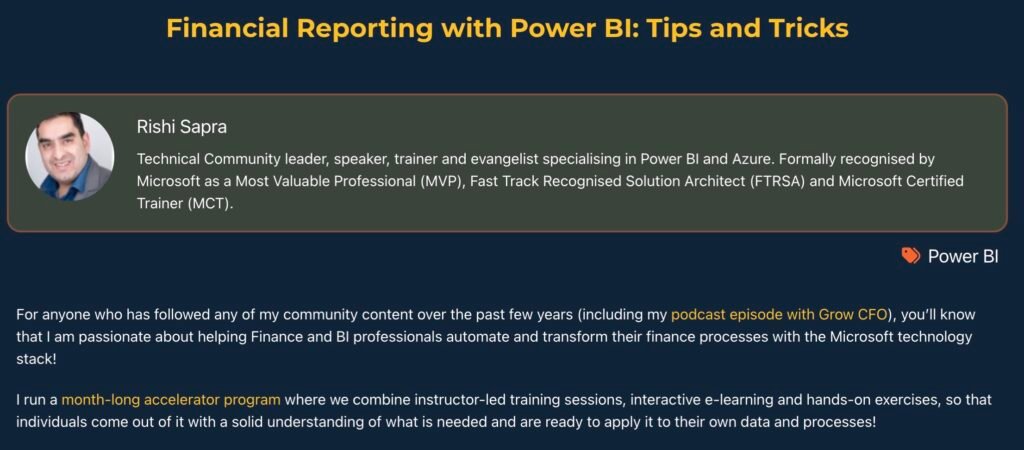
In this webinar, Rishi will show how you can harness the potential of Power BI to build automated reports that your stakeholders can self serve on!