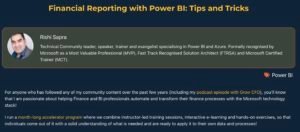
Rishi Sapra
Rishi Sapra

Real-World Solutions, Built to Inspire & Empower

Explore a curated collection of Power BI reports, Microsoft Fabric solutions, e-learning content, and event recordings developed by me

These solutions are designed to help you solve real business challenges using data storytelling, automation, and advanced analytics. Whether you're in finance, supply chain, or operations, you’ll find tools, templates, and training materials that can be adapted to your unique context.

What You’ll Find?

Power BI Dashboards & Templates

Industry-specific use cases — from financial reporting to operational insights — built for clarity and impact.

E-Learning Content

On-demand courses and resources to help you master Power BI, Microsoft Fabric, and more.

Event Recordings & Presentations

Catch up on Rishi’s sessions from global conferences and community events.

Expert Techniques & Best Practices

Learn how to apply storytelling, data modeling, and DAX to build smarter, more actionable insights.

Power BI Dashboards & Templates

Industry-specific use cases — from financial reporting to operational insights — built for clarity and impact.

E-Learning Content

On-demand courses and resources to help you master Power BI, Microsoft Fabric, and more.

Event Recordings & Presentations

Catch up on Rishi’s sessions from global conferences and community events.

Expert Techniques & Best Practices

Keep up with the latest features, tools, and strategies shaping the future of data-driven decision-making.

Power BI Dashboards & Templates

Industry-specific use cases — from financial reporting to operational insights — built for clarity and impact.

E-Learning Content

On-demand courses and resources to help you master Power BI, Microsoft Fabric, and more.

Event Recordings & Presentations

Catch up on Rishi’s sessions from global conferences and community events.

Expert Techniques & Best Practices

Learn how to apply storytelling, data modeling, and DAX to build smarter, more actionable insights.

Portfolio

AI
Copilot
Data
data visualisation
e-learning course
Exam Prep
Excel
Fabric
finance
Financial Modelling
Governance
Power BI
Project Use Case
quizzes
Report Example
Storytelling
Synapse
Technology
Storytelling with Data (Power BI and Fabric Manchester)

Storytelling with Data (Power BI and Fabric Manchester)

Communicating through telling stories is an innate part of what it means to be human. It’s what allows us to share beliefs and build connections in a way that the brains of other animal species simply aren’t wired to do. We’re used to telling stories through essays and creative writing, but when it comes to […]
Credit Risk Modelling in Excel, Power BI and Fabric

Credit Risk Modelling in Excel, Power BI and Fabric

This solution explores how to transform an Excel-based credit rating model for government authorities into an interactive and scalable report using Power BI and Microsoft Fabric. Participants learn techniques to modernise complex financial models and leverage the advanced capabilities of Power BI for analysis and storytelling. • Replicating Complex Rating Logic: Translating intricate credit rating […]
Power BI for Financial Data e-learning course (Beginner/Intermediate)

Power BI for Financial Data e-learning course (Beginner/Intermediate)

Using a realistic accounting dataset, this course empowers you to automate your month-end reports using the built-in data transformation, logic and visualisation capabilities of Power BI. You will be able to generate powerful insights on financial performance all without the manual effort of continually producing different cuts of data/pieces of analysis. Upon completion, participants will […]
E-learning course: Fabric and Power BI Governance

E-learning course: Fabric and Power BI Governance

This free e-learning course is a fun and interactive way for participants to learn about Fabric Governance with role-play avatar videos and interactive exercises. In these videos there are debates around how to balance the requirement for self-service with implementing sufficient technical controls to restrict access to potentially sensitive data. The course is split across […]
Power BI and Fabric Copilot course

Power BI and Fabric Copilot course

In this 1 hour e-learning course which uses a Finance dataset (the same I use on the Financial Reporting with Power BI course), I cover how to leverage tools such as Power BI/ Fabric Copilot, and Generative AI tools more broadly, to automate the full end-to-end analytics workflow This workflow covers everything from requirements gathering […]
Grow CFO Webinar – Interactive Financial Statements in Power BI

Grow CFO Webinar – Interactive Financial Statements in Power BI

Event Description: If you’ve tried using Power BI for financial analysis or reporting, you’ve likely found that simple things like subtotals, sorting and mixed formats (e.g. currency and percentages) for financial statements appear to be much harder than they should be!  But the data model that sits behind a Power BI report can support all of these things out of the box and brings many additional […]
Institute of Chartered Accountants in England and Wales (ICAEW) – Harness the potential of Power BI to solve data challenges

Institute of Chartered Accountants in England and Wales (ICAEW) – Harness the potential of Power BI to solve data challenges

In a session presented to nearly 1000 chartered accountants/ICAEW members (with 50+ questions asked in the chat!) , I presented an overview of Power BI and its application to Finance. In this session I explored how Power BI can be leveraged to address the common challenges and roadblocks finance teams face when using complex and […]

SQL Bits 2022 – Power BI Governance 6 Steps to success 

So you’ve had Power BI in your organisation for a few years now, and it’s grown rapidly at a grassroots level, but you have little or no central oversight of what’s been developed, what content is being consumed and who its been shared with. How do you get a handle of your Power BI environment […]
New York City Taxi Report (2.4bn rows)

New York City Taxi Report (2.4bn rows)

This report takes a 2.4 billion row dataset on New York City taxis and looks at how to build a complete end-to-end solution using Azure Synapse and Power BI. In the session linked to below, we cover everything from designing an data model with an aggregated fact table, ingesting data from Azure SQL DW into […]

Building an Income Statement End to End

In this session Rishi will show how to build an Income Statement in Power BI end-to-end, looking at: • Capturing requirements for the report and scoping/designing a data model with scattered/inconsistent transaction data • Use of an “FS Lines” table to have metadata-driven financial statements including custom calculations • Creating Dataflows to ingest data from […]

Financial Reporting with Power BI and Excel

In this session Rishi will show how to build an Income Statement in Power BI end-to-end, looking at: ​ • Capturing requirements for the report and scoping/designing a data model with scattered/inconsistent transaction data ​ • Use of a “FS Lines” table to have metadata driven financial statements including custom calculations ​ • Creating Dataflows […]

Microsoft Power BI UK User Group – Power BI Governance 6 Steps To Success 

Join our Microsoft Power BI – UK User Group for our monthly webinar in association with Onyx Data (onyxdata.co.uk). This month we are excited to announce our host Leon Gordon will be introducing Microsoft MVP Rishi Sapra. So you’ve had Power BI in your organisation for a few years now, and it’s grown rapidly at […]

PUG Italy Webinar – Why Accountants Should Love Power BI

The Italian Power BI User Group is proud to present Rishi Sapra (MVP), who joined us to talk about some of the Power BI features that accountants could find particularly useful in the fifth webinar of our 2020/2021 season!

Modernising the Finance Function with Power BI – Rishi Sapra (Altius) and Amy Boyd (Microsoft UK)

In this comprehensive overview of Power BI (Desktop and service) applied to a finance scenario, learn how to take advantage of all the functionality that Power BI has to offer including: – Automatically consuming files in a folder – Storytelling with data – Dynamics graphs and measures – Waterfall charts and tables – Row Level […]

Internal and External Sharing/Distribution in Power BI

A recording of the session held for the Power BI Manchester User Group (Virtual) on 30th April 2020 where Rishi covered admin tips and tricks as well as a comprehensive overview of the various options for sharing and distributing Power BI content, internally and externally

Modern Power BI Architecture with Dataflows

In this episode, we’re joined by Microsoft MVP and Senior Power BI Consultant Rishi Sapra (https://twitter.com/rsaprano). We’ll look at how Power BI can be deployed at an enterprise scale using dataflows. Combined with Governance and adoption strategies, this allows companies to implement managed self-service Intelligence across a large organisation.

Power BI Days – Aggregations and What if Scenario Modelling in Power BI

Power BI isn’t just a read-only historical view of your data – you can also enter parameters which feed into your model and drive outputs under different scenarios. In this session Rishi will show this process using a simple Power Apps form embedded into Power BI, supported by a basic workflow. This solution is made […]
Case Study: Environment Agency Project Report

Case Study: Environment Agency Project Report

This report was for my (fictional) interview case study at Altius in August 2016 and was later published into the community. The slide images below show the full thought process of this as a project from Requirements gathering to Power BI Report build to future architecture design with “Real-time” insights driven from the Environment Agency […]
Rishi Sapra